
Minister Support in Rural and Small Town Churches of Christ: Findings from the 2025 Ministers’ Salary Survey
Abstract
This study explores the current state of minister support within Churches of Christ, particularly in rural and small-town settings. Following the COVID-19 pandemic, nearly half of pastors surveyed by the Exploring the Pandemic Impact on Congregations (EPIC) study considered leaving their congregations. Despite some improvements in clergy well-being, declining church attendance and financial strain persist. Using data from the 2025 Ministers’ Salary Survey, we examine differences in compensation by location, gender, education, and age.
The Siburt Institute has conducted the Ministers’ Salary Survey for over 20 years. This most recent survey was conducted from January 8 to March 17, 2025. The survey measures ministerial compensation packages (including allowances and benefits), as well as years of experience, educational background, and other relevant characteristics. New in the 2025 survey was a question about the location of the congregation; ministers were asked if their church was located in an urban, suburban, rural, or small-town location. This article examines the differences in minister compensation across various locations, with a particular focus on the experiences of ministers in small towns and rural areas.
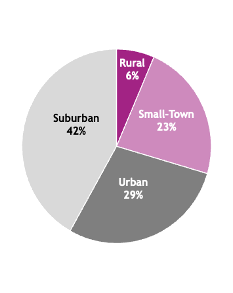
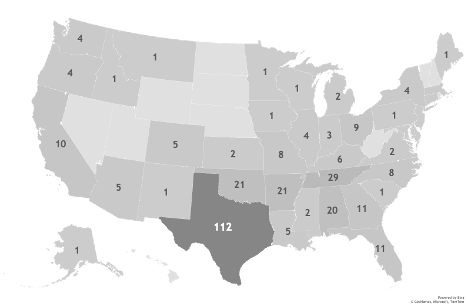
Our analysis begins with an overview of the data; more detailed information can be found at https://www.siburtinstitute.org/salarysurvey, where you can review the data for the last eight years. Three hundred twenty-five ministers completed the survey. As shown in the pie chart below (Figure 1), 29% of respondents report that their congregations are located in a small town or rural area. The map of the USA (Figure 2) shows the states where the respondents are from, as expected, Texas has the highest number of respondents followed by Tennessee.
Figure 1 Location of the Congregation
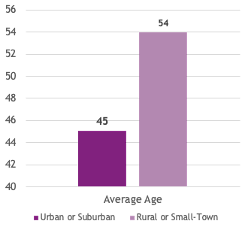
Breaking down the respondents by gender (Table 1), we find that the majority of ministers, regardless of the locale, are men. However, a higher percentage of urban or suburban ministers are women compared to small-town or rural areas. The difference in the average age (Table 2) of ministers by locale is statistically significant, with the average age of ministers in small towns or rural areas being 54 years, and those in urban or suburban areas being 45 years old. We also examined the ministry roles of respondents. We found that ministers in small-town and rural areas are more likely to be the lead/preaching/senior minister, or a solo minister. 71.9% of small-town and rural ministers fall into this category. In comparison, only 43.2% of ministers in urban and suburban areas report that they are the lead/preaching/senior minister, or solo minister.
Figure 1 Map of Respondents to the 2025 Ministers' Salary Survey
Breaking down the respondents by gender (Table 1), we find that the majority of ministers, regardless of the locale, are men. However, a higher percentage of urban or suburban ministers are women compared to small-town or rural areas. The difference in the average age (Table 2) of ministers by locale is statistically significant, with the average age of ministers in small towns or rural areas being 54 years, and those in urban or suburban areas being 45 years old. We also examined the ministry roles of respondents. We found that ministers in small-town and rural areas are more likely to be the lead/preaching/senior minister, or a solo minister. 71.9% of small-town and rural ministers fall into this category. In comparison, only 43.2% of ministers in urban and suburban areas report that they are the lead/preaching/senior minister, or solo minister.
Table 1 Gender of Respondent by Church Location
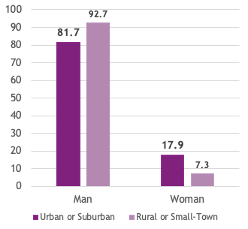
Table 2 Average Age of Respondent by Church Location
In addition to the demographic differences among the respondents, we also observe significant variations in some basic congregational characteristics. To start, rural and small-town congregations tend to be smaller than their urban and suburban counterparts (Table 3). The median size for rural and small-town churches is in the 51 to 100 average attendance range. The median size for urban and suburban churches is in the 251 to 500 average attendance range. As a result of the difference in church size, ministers in churches located in rural and small-town areas have a lower average number of elders and paid staff members (Table 4). Our last congregational characteristic that we’ll compare is the operational budget (Table 5). The median operational budget for urban and suburban congregations is $725,000, while the median budget for rural and small-town churches is approximately one-third that amount, at $250,000.
Table 3 Average Attendance by Church Location
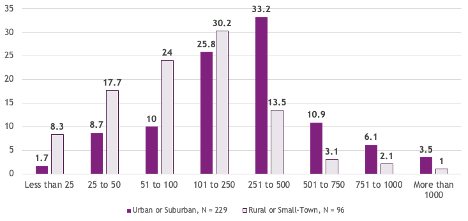
Table 4 Average Numbers of Elders or Shepherds and Numbers of Paid Staff by Church Location
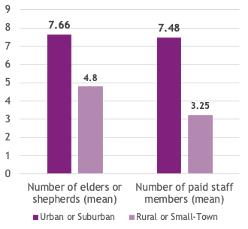
Table 5 Median Church Operational Budget by Church Location

Now, let’s get to compensation. For compensation, I’ve opted not to combine urban and suburban, or rural and small-town, and instead look at the numbers for each category. Table 6 shows average total compensation by locale. Total compensation includes the monetary value of all benefits, such as housing, books, cell phone, travel, continuing education, utilities, and other allowances and reimbursements. When considering only base salary, the median for urban and suburban areas is $70,000, while the median for rural and small-town locales is $54,500. Ministers in rural areas have the lowest average compensation, at $43,970, followed by ministers in small towns at $62,276, suburban ministers at $71,861, and urban ministers with the highest compensation at $76,036. We can do some speculation on these differences; much of this is due to the size of the congregation and the cost-of-living differences between different locales. There are also more part-time ministers (18.8%) in rural and small-town locales than in urban and suburban areas (10.5%) (Table 7). However, the differences are not related to years in ministry, as rural ministers average 38 years of experience (Table 8), a solid 18 years more than urban ministers and 19 years more experience than suburban ministers. It’s also worth noting that for 28% of rural/small-town ministers, this is not their only source of income, compared to 21% of urban/suburban ministers.
Table 6 Total Compensation

Table 7 Full-Time and Part-Time

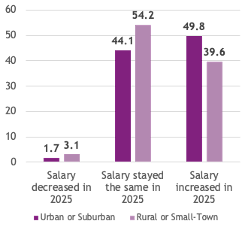
In thinking about raises over the last year, Table 9 shows that about half of urban and suburban ministers and just under 40% of rural and small-town ministers saw a salary increase in 2025.
Table 8 Total Years in Ministry
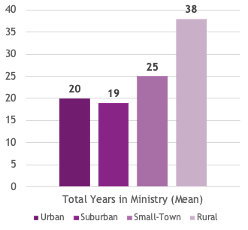
Table 9 Salary Increase or Decrease for 2025
Our final consideration is the types of additional allowances that ministers receive outside of their salary. Table 10 presents the various types of allowances that we inquired about in the survey.
Table 10 Additional Allowances
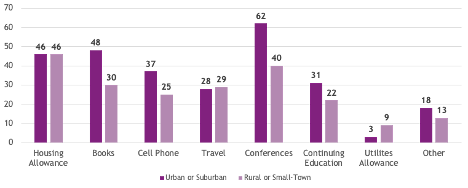
Overall, the findings reveal a clear pattern: rural and small-town ministers are more likely to serve as the sole minister on staff, receive lower compensation, and have fewer additional allowances. These realities raise an important question: how can we better support ministers who carry heavier ministry loads with limited resources and often lack the financial means to participate in essential conferences, personal development, or relational support opportunities? The data underscores the opportunity to foster greater support for ministers serving with the complexities revealed through this study's findings.